Manual
To register and login follow the self-explanatory instructions menu. Start mining GEM+S and move the cursor to the top of the page to activate the fading menu bar. For your best mining experience expand to full screen. Open new tabs to compare results for several companies at the same time by right-clicking on the link "Manual" on the top right corner of the welcome page. The intuitive design of the tool makes it easy to use; first look at the right end of the fading menu bar:
RPP (GEM+S Reference Portfolio Positions): the long term performance record of these portfolios shows the relevance of the GEM+S analytical approach. GEM+S provides you with the list of the current year’s stock selection in its USD, EUR and CHF portfolios as a special benefit for subscribing to this tool.
Result: the current year’s selection is based on the previous year’s 4th quarter GEM+S analytics and positions only exceptionally change due to market driven re-balancing, but usually remain unchanged during the calendar year, sometimes over several years - long term investing wins over short term trading passions.
The performance record shows:
- 80% probability that system users can outperform the market on a yearly basis
- 85 to 100% probability that this works for 3 year periods
- 100% probability that any 5 or 10 year comparison wins against its respective market index by a big margin
Settings: manage your subscription following the self-explanatory instructions menu.
Contact: contact us with your comments or questions regarding your mining experience.
Now turn to the real mining experience
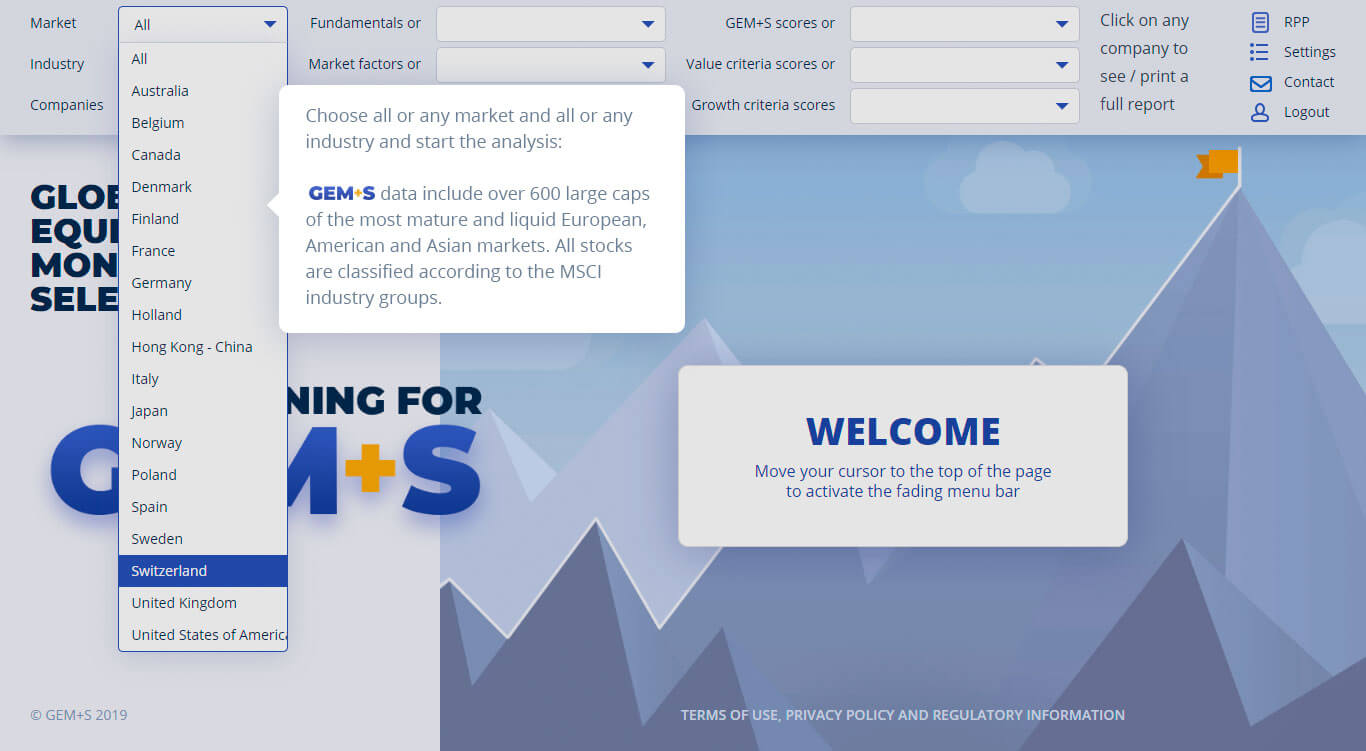
First: choose the Market in which you wish to analyze companies. Choose All if you want a global perspective; however, given the different market maturity, market capitalization and reporting standards you may want to be cautious when drawing final conclusions for single companies’ rankings across all markets.
Result: all your further queries will refer to your choice of markets.
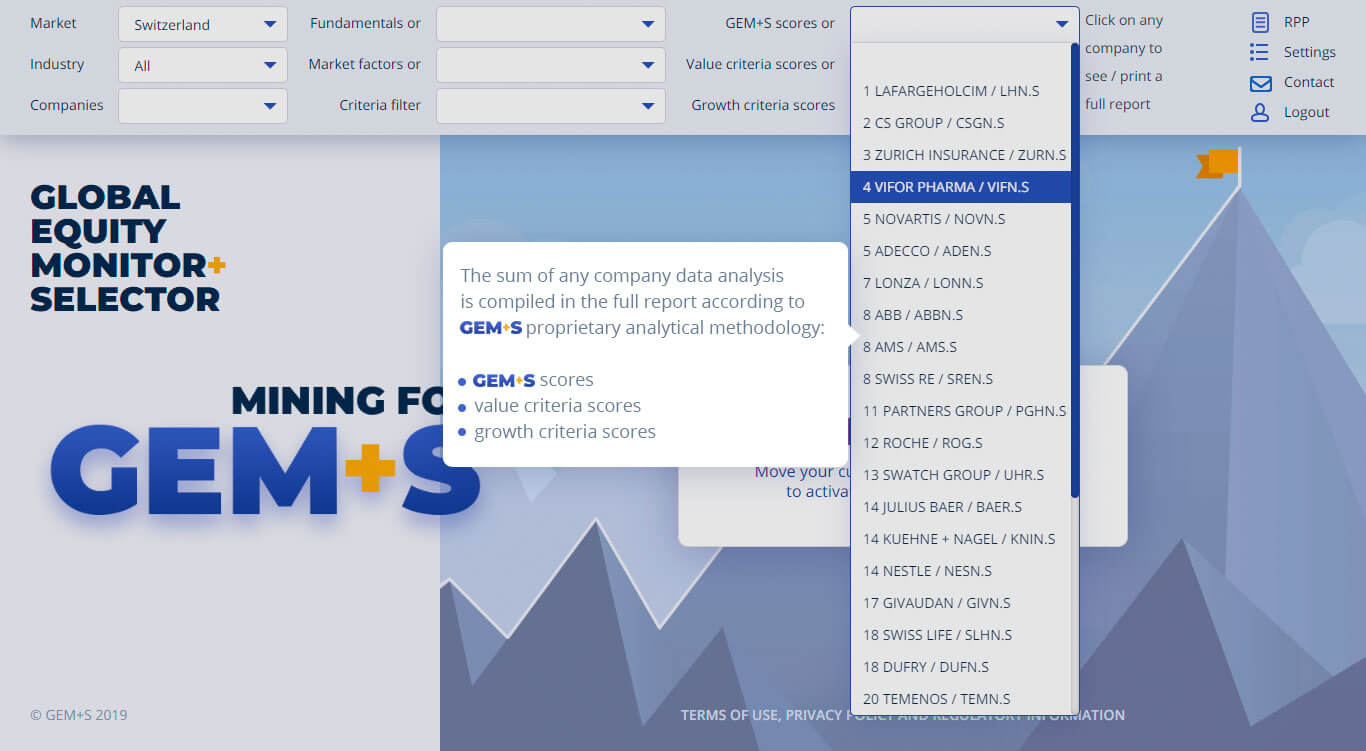
You can directly move your cursor on the fading menu bar to the right and choose a full company report from the three drop-down lists available.
Second: choose the Industry Group (MSCI classification of 10 groups) or All industry groups of a chosen market.
Result: all your further queries will refer to your choice of markets and industry groups.
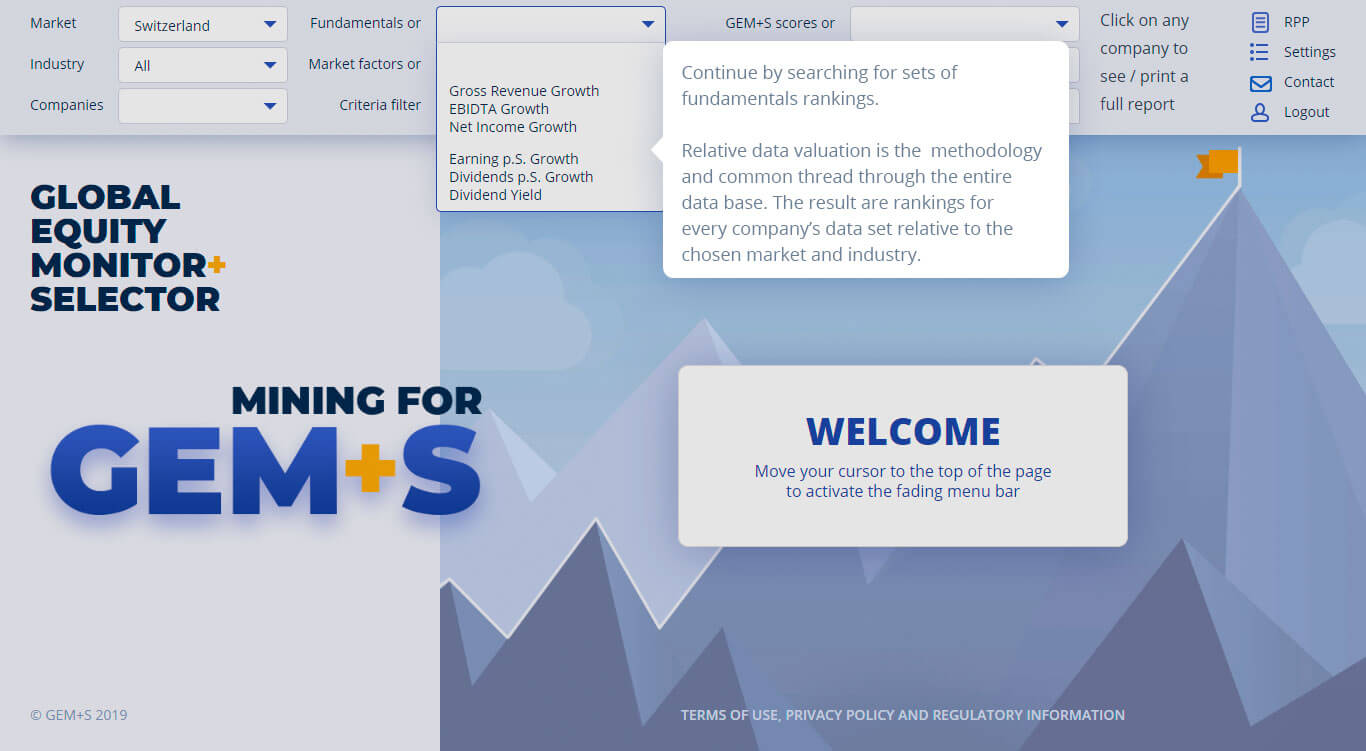
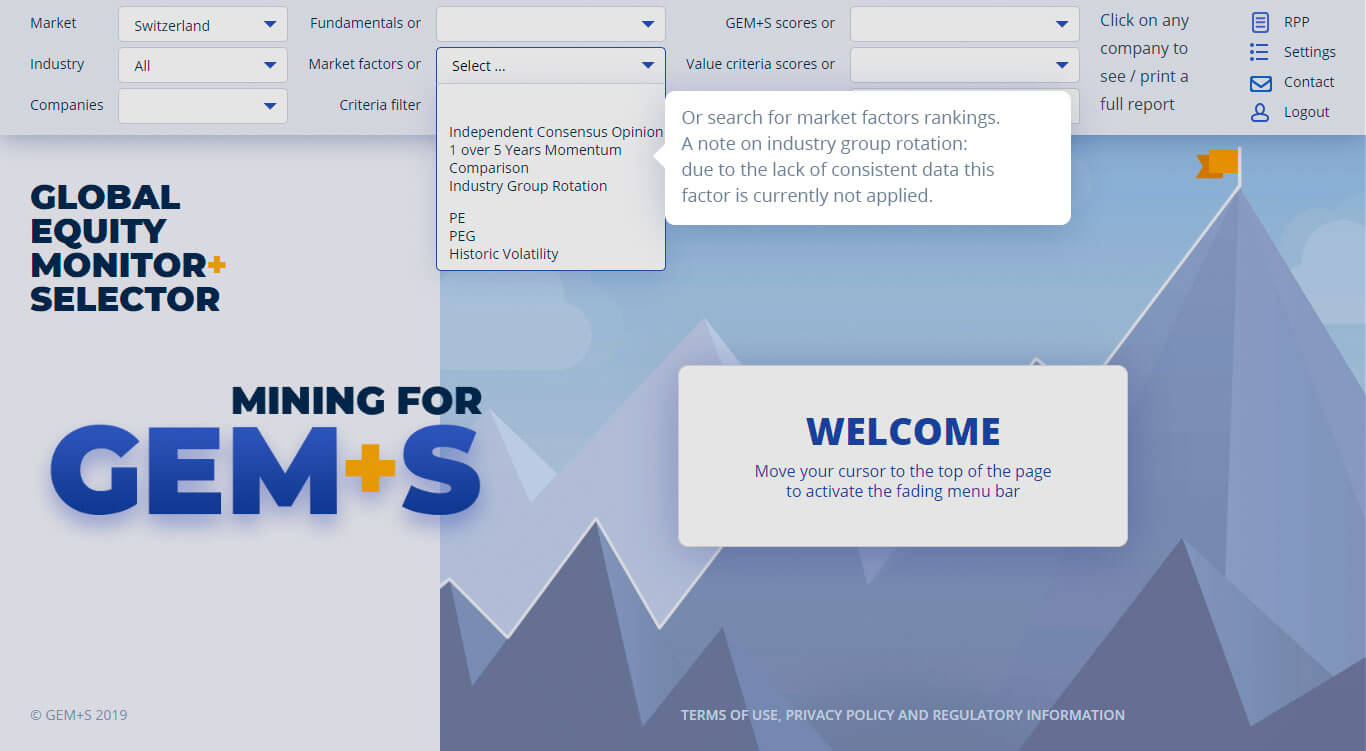
Third: choose Fundamentals or Market Factors, if you wish to analyze the rankings of companies within the chosen market. Fundamentals and market factors are based on consensus data pooled from typically 5 to 20 analysts covering a particular company.
Result: click on a block of three fundamentals or market factors:
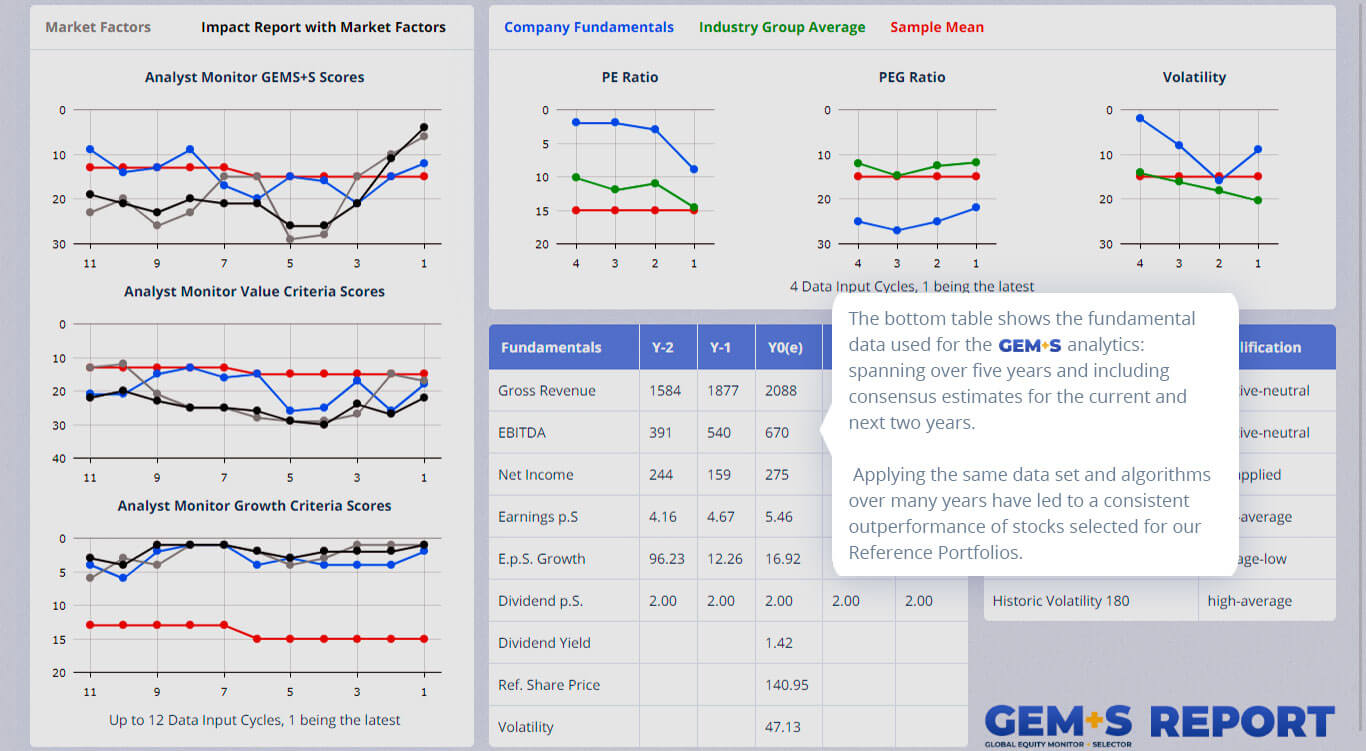
Fundamentals: obtain best-in-class rankings of top and bottom line data for your chosen sample of companies. The data cover 5 years for each criterion including estimates for the current and the following two years. The fundamentals covered are:
Gross Revenue growth
EBITDA growth
Net Income growth
Earnings per Share growth
Dividends per Share growth
Dividend Yield
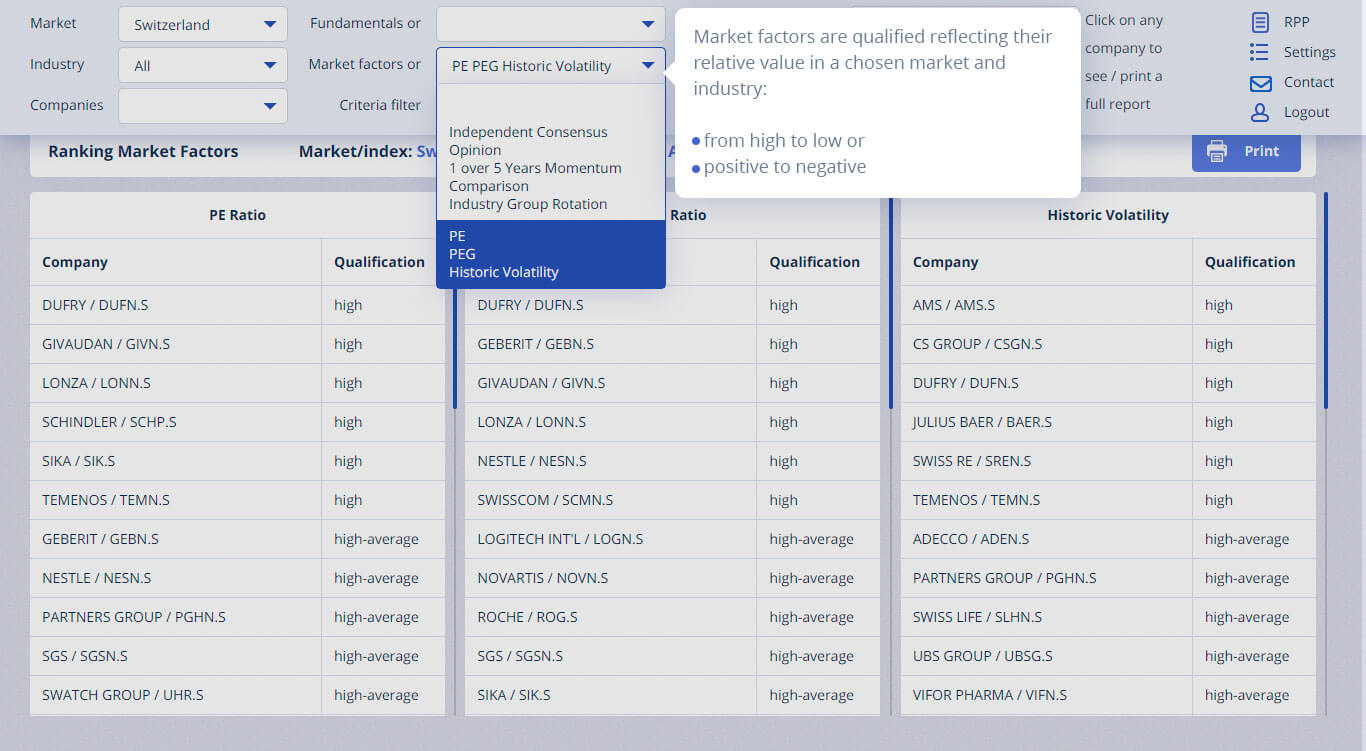
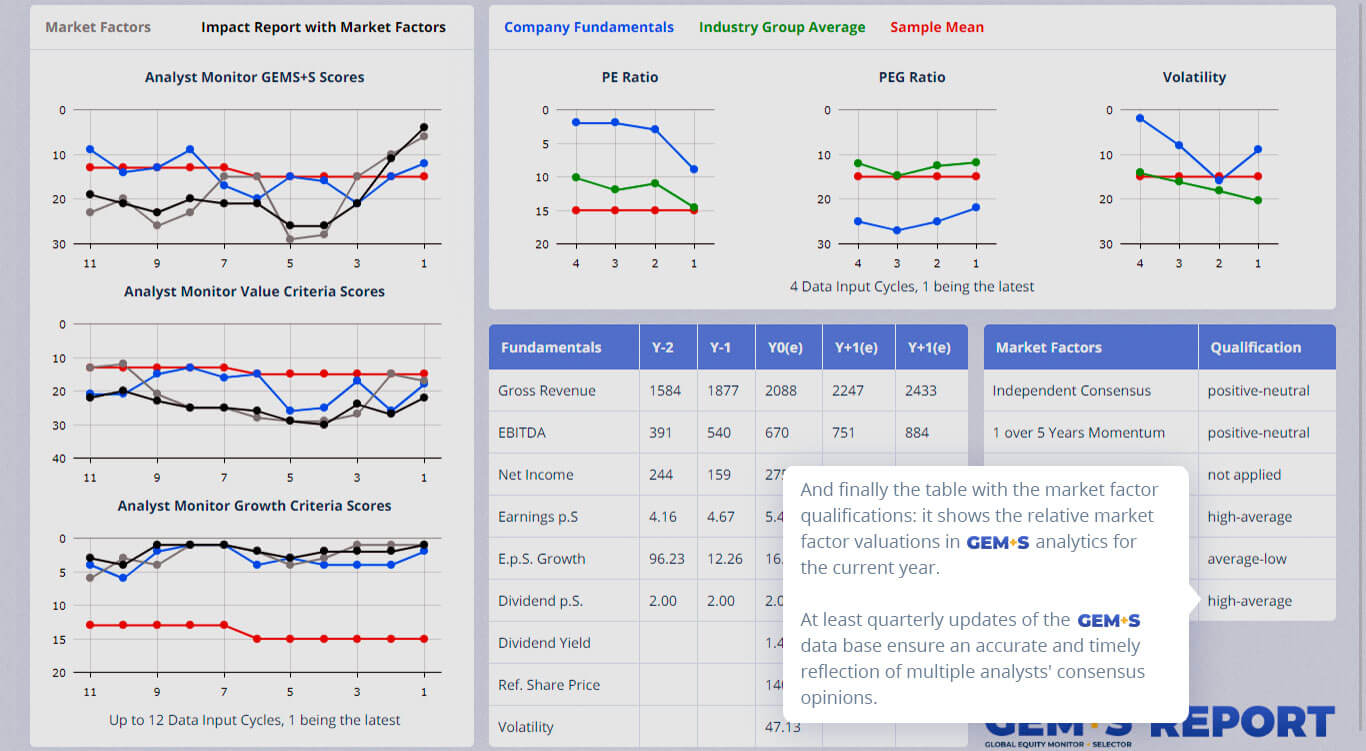
Market Factors: these criteria do not primarily reflect fundamentals but rather the market conditions for a company’s share price. The results are shown with 5 qualifiers from positive to negative or high to low:
Independent Consensus Opinion about the future price trend of a share
1 over 5 Years Momentum of a share price vs. the market
Industry Group Rotation, cycle momentum (not applied, no consensus data across markets available)
PE vs. Market, ratio between current share price and earnings estimate vs. the market
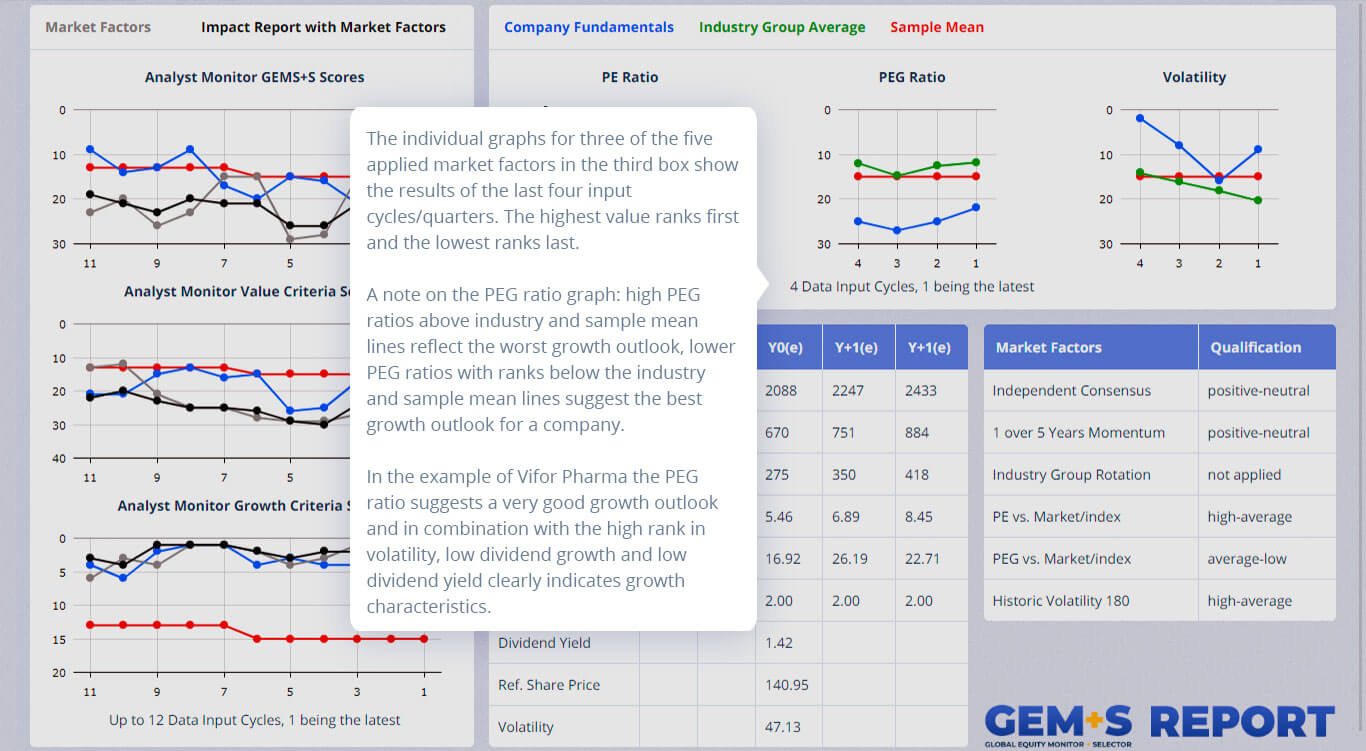
PEG vs. Market, ratio between PE and estimated EPS growth vs. the market; the lower the ratio (= bigger the ranking number) the more attractive the stock
Volatility of a share price relative to the market volatility (180 days volatility)
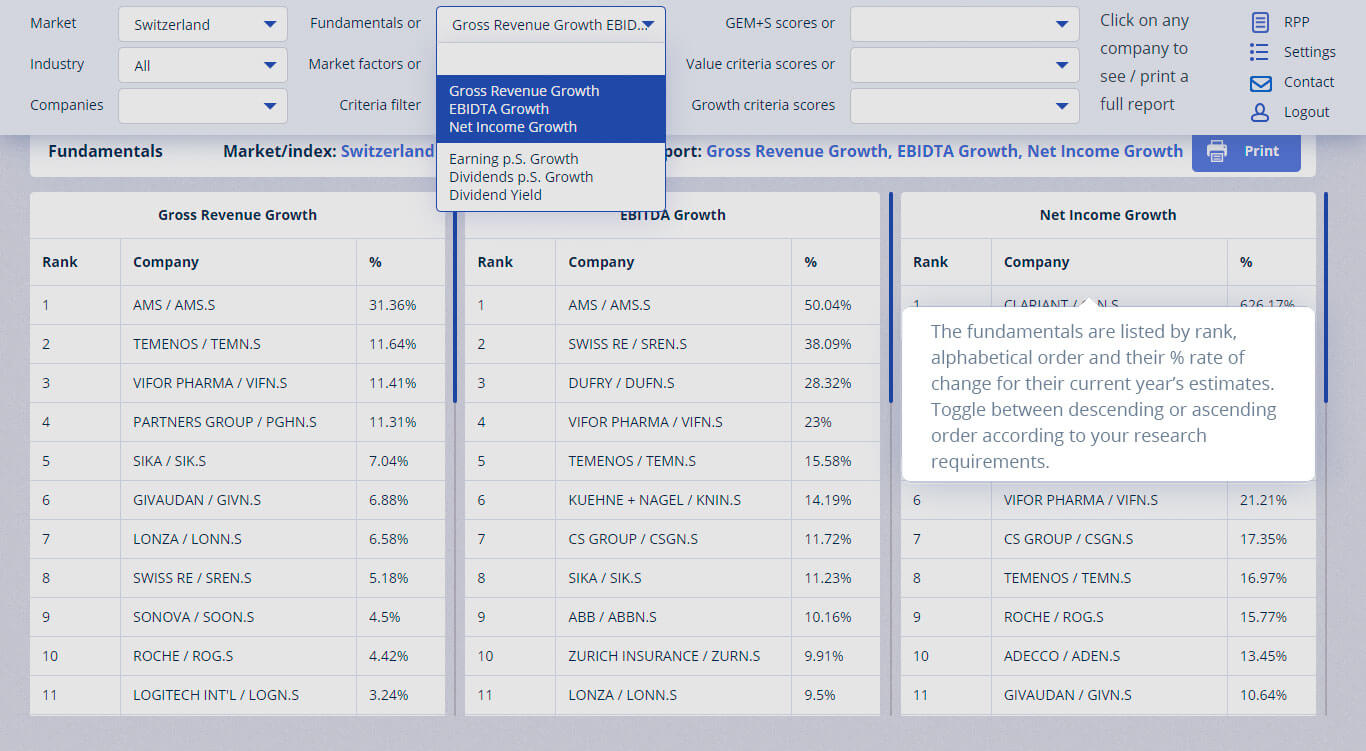
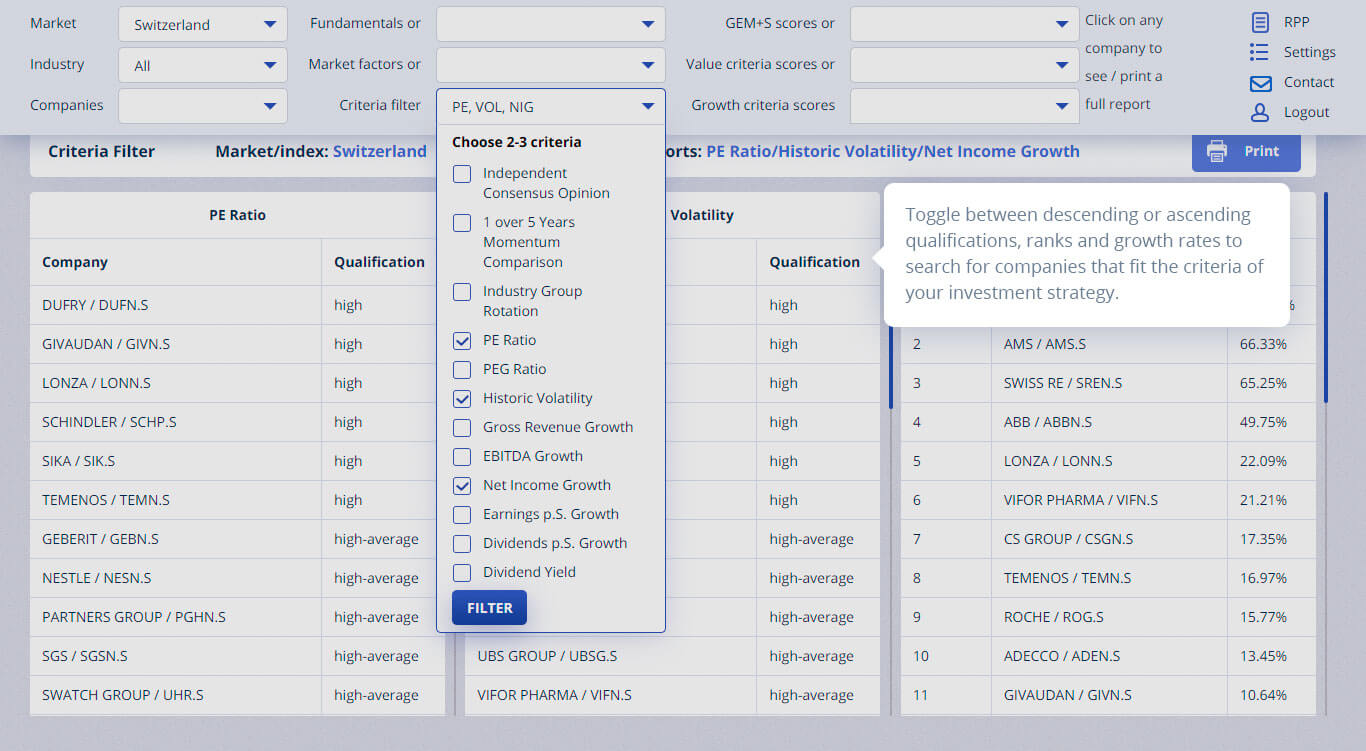
Tables: shown as results of your queries contain a group of three criteria. Click on the top line of the tables to toggle between
highest to lowest rank,
alphabetical up or down order of companies or
highest to lowest percentage or qualifier
Fourth: choose the type of rankings you want GEM+S to produce; according to GEM+S proprietary analytics criteria scores, Value criteria or Growth criteria scores.
Result: click on a company name on the drop-down ranking list to obtain the full report:
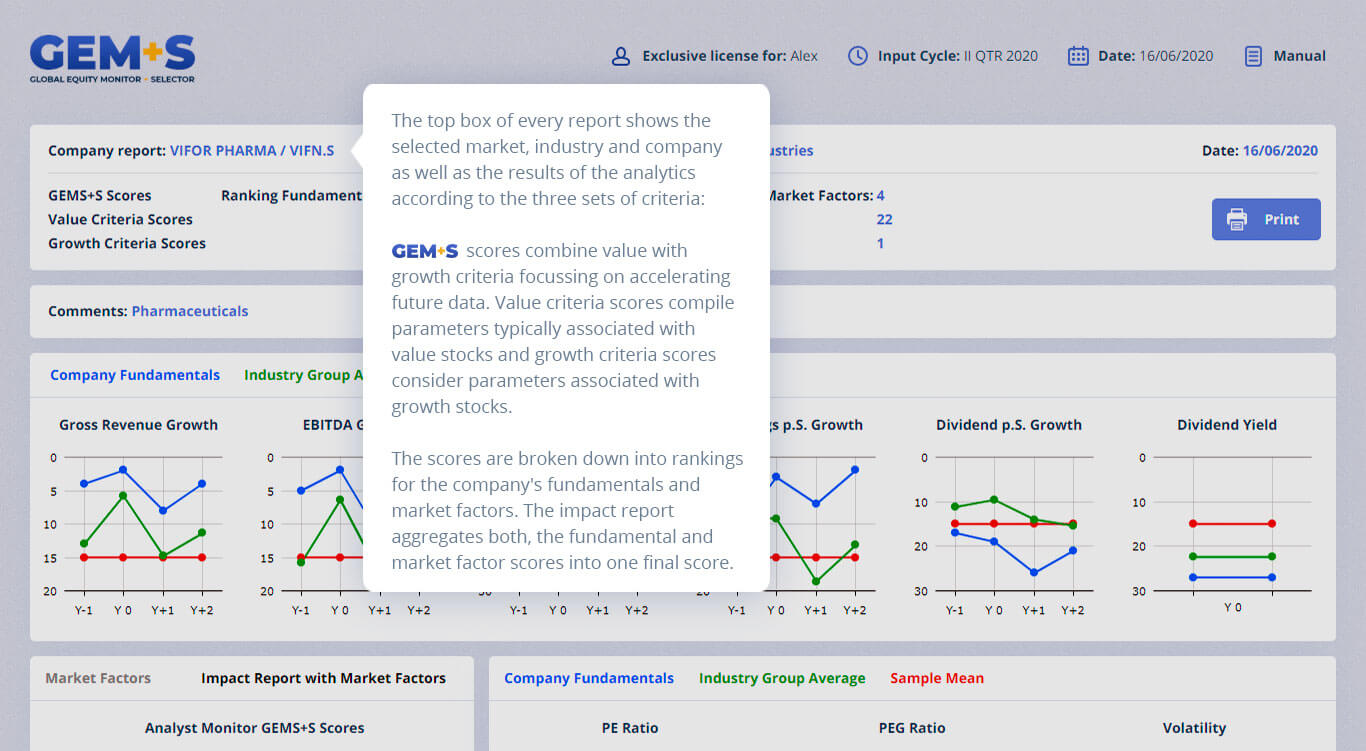
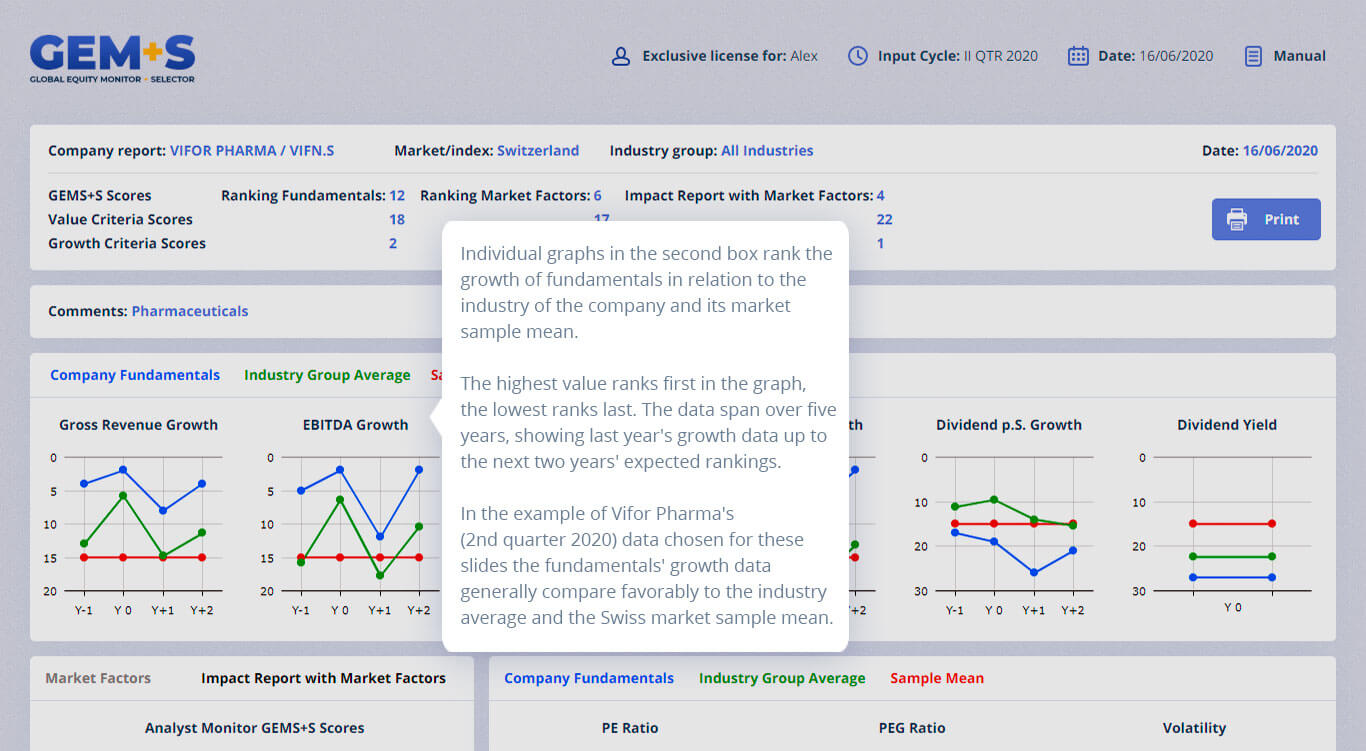
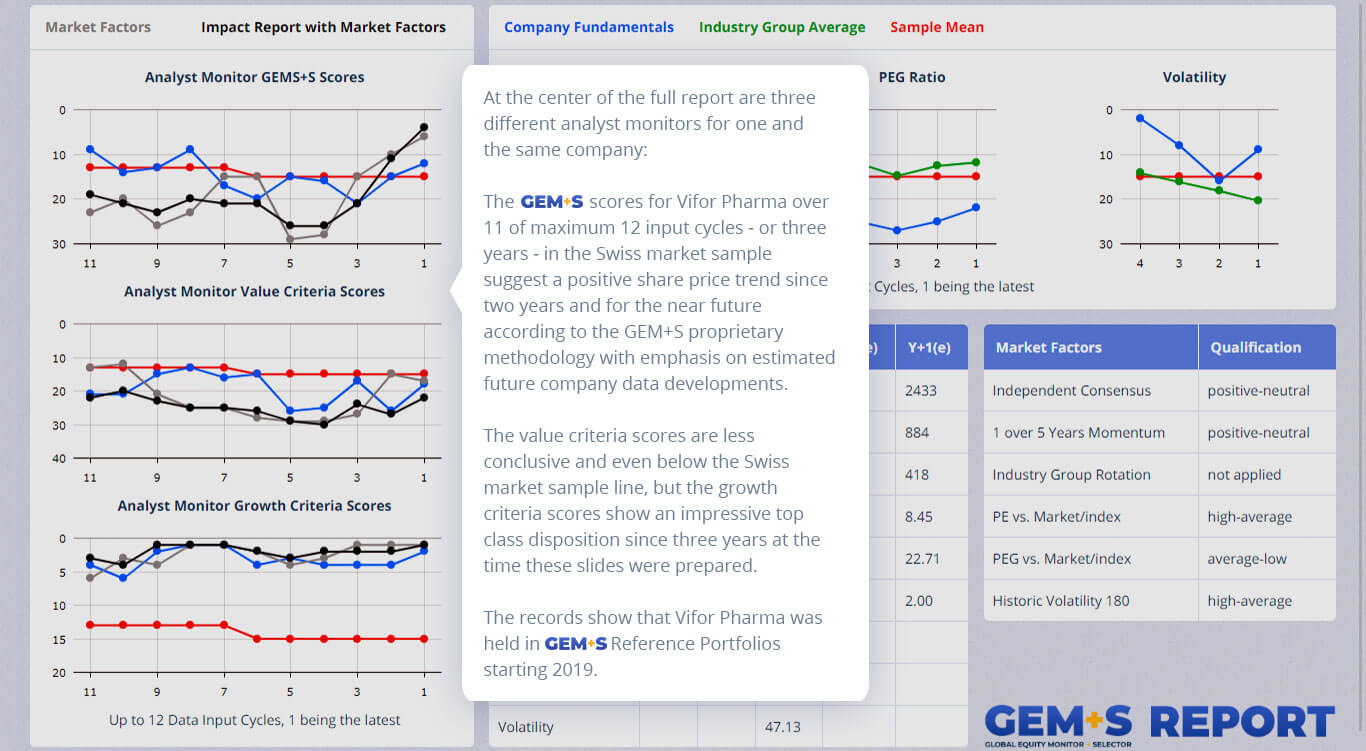
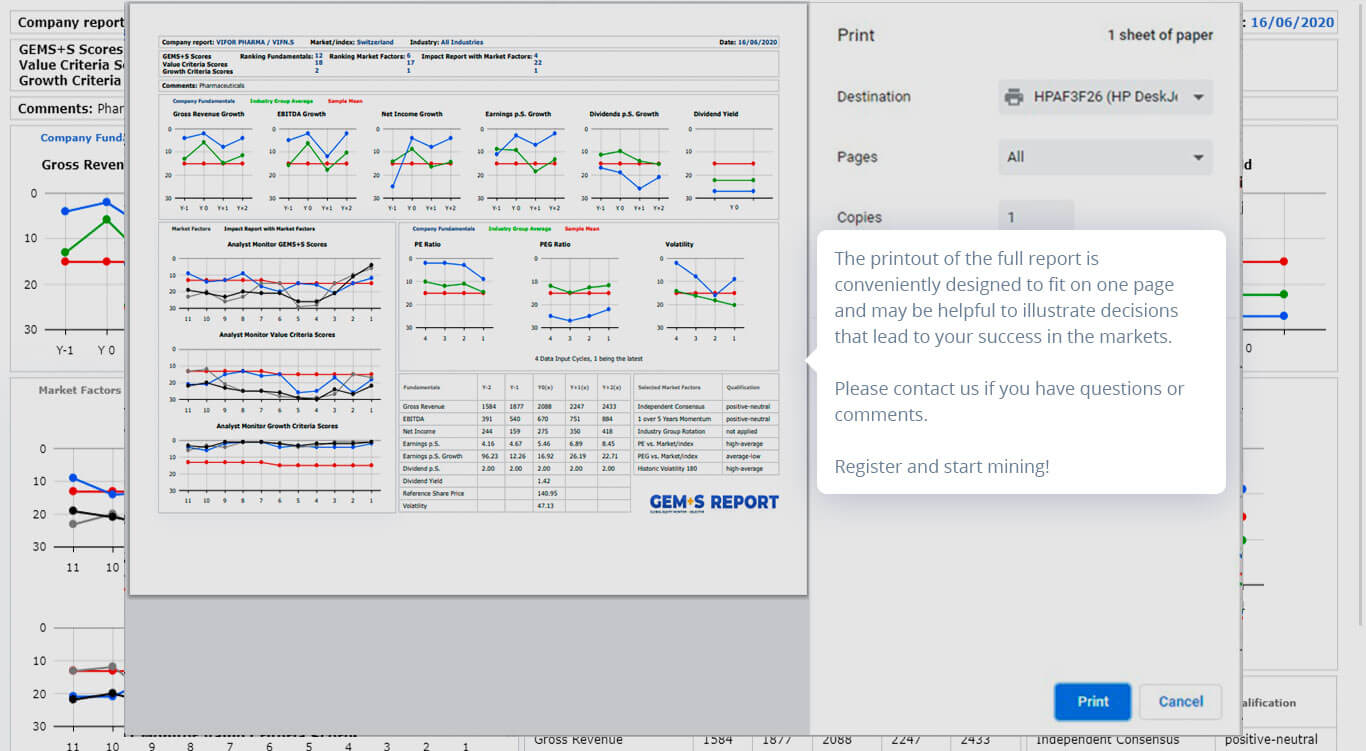
Full Report: it gives you the details with all fundamentals, market factors and the 3 Analyst Monitors including the raw data used for this analysis in comprehensive graphs and tables on one page. Fundamentals and market factors graphs will always include the ranking of a company relative to its industry group and the chosen market sample mean.
Analyst Monitors: they show the amalgamated ranking results of all analysts’ inputs according to GEM+S, value and growth criteria scores. Compare these consensus rankings with the performance of stocks and appreciate their relevance – take it “cum grano salis"! If the general direction of the consensus rankings is positive over time, the stock price tends to move up as well, and vice versa. The analyst monitors also include – as an additional ranking – the Impact Report of Market Factors: its ranking shows how the fundamentals ranking of a company is impacted by its market factor ranking according to the GEM+S methodology of amalgamating fundamentals and market factors according to GEM+S, value or growth criteria. A substantial difference in the fundamentals and market factors rankings may indicate an undervaluation of a share (top rank in fundamentals and bottom rank in market factors) or an overvaluation (bottom fundamentals and top market factors). All other graphs and tables of the full report are the same irrespective of the different analyst monitors.
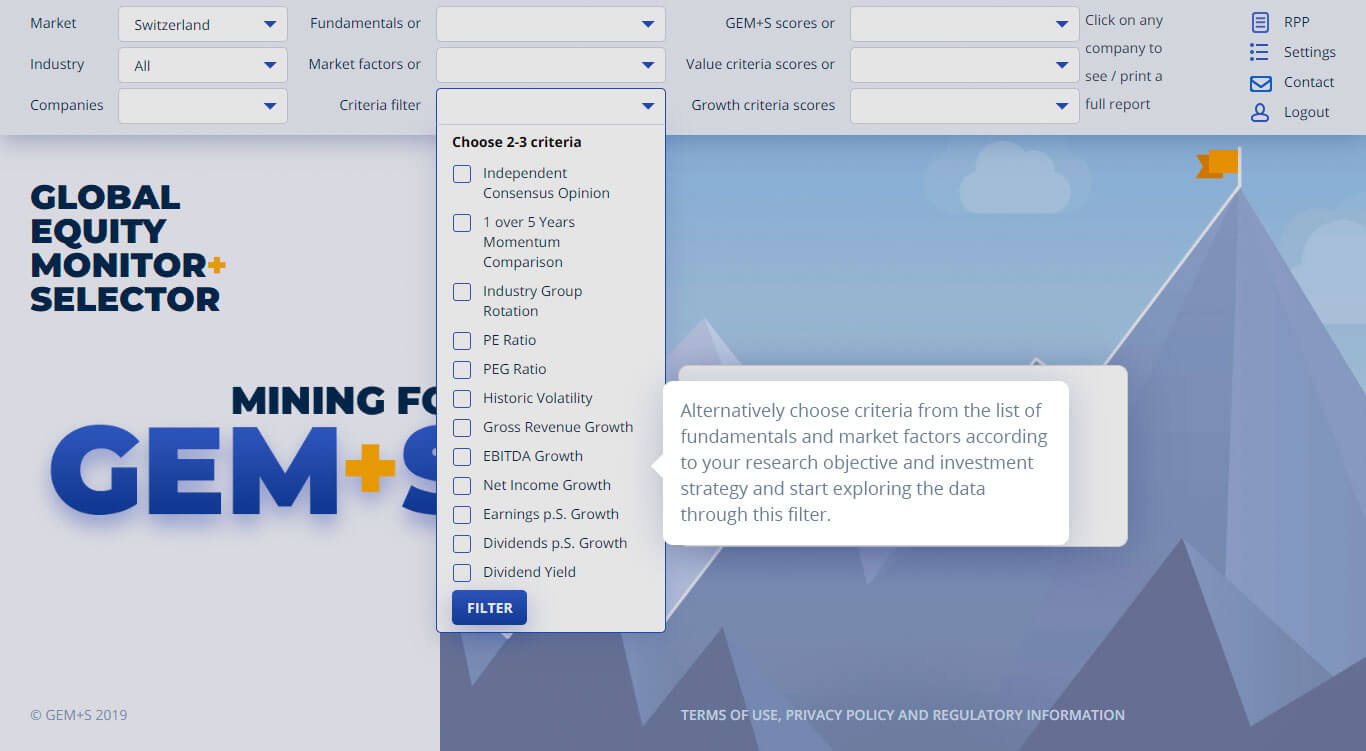
Fifth: search for your preferred combination of fundamentals and market factors and click Filter to filter/search for companies that meet your requirements and chosen strategy.
Result: you may be searching for specific investment strategies or risk appetite, for example:
Defensive Strategy: high dividend yield and net income growth combined with low PEG ratio, allowing for an allocation in stocks with solid fundamentals and good growth perspectives.
Trading Opportunities: high gross revenue growth and PE ratio combined with high volatility indicate potential for trading based short term decisions
Turn-around situations: look for positive 1 over 5 years momentum, low PEG ratio with accelerating EPS growth to identify stocks with an improved investment outlook.
Growth Strategy: look at the results of the growth criteria rankings and compare these findings with your own selection of relevant growth criteria.
Value Strategy: look at the results of the value criteria rankings and compare these findings with your own selection of relevant value criteria.
GEM+S selection: look at the results of the GEM+S proprietary method ranking and compare these findings with your own selection of relevant criteria, or add stocks you like from the list of the reference portfolio positions. Don't forget, the system also helps you to identify stocks you don't want to invest in!
Important: don't rely on one single criterion when making a choice. Successful stock selection requires a multi-parameter perspective: our Reference Portfolio Positions need top percentile results in 5 to7 parameters to make it into the selection.